This functions assign input rates for the plots created by make_exp_plots() according to the rate designs specified by the user in rate_info, which can be created by prep_rateingle().
Examples
#--- load experiment plots made by make_exp_plots() ---#
data(exp_data)
exp_data
#> # A tibble: 1 × 14
#> input_name unit_system field_sf headland exp_plots ab_lines harvest_ab_lines
#> <chr> <chr> <list> <list> <list> <list> <list>
#> 1 NH3 imperial <sf> <sf> <sf> <sf> <sf [1 × 2]>
#> # ℹ 7 more variables: plot_width <dbl>, harvester_width <dbl>,
#> # machine_width <dbl>, section_num <dbl>, headland_length <dbl>,
#> # side_length <dbl>, abline_type <chr>
#--- load rate information ---#
data(rate_info)
rate_info
#> # A tibble: 1 × 11
#> input_name rates_data design_type num_rates gc_rate unit tgt_rate_original
#> <chr> <list> <chr> <int> <dbl> <chr> <list>
#> 1 NH3 <dt [5 × 2]> ls 5 30 gallo… <dbl [5]>
#> # ℹ 4 more variables: tgt_rate_equiv <list>, rank_seq_ws <list>,
#> # rank_seq_as <list>, rate_jump_threshold <lgl>
#--- assign rates ---#
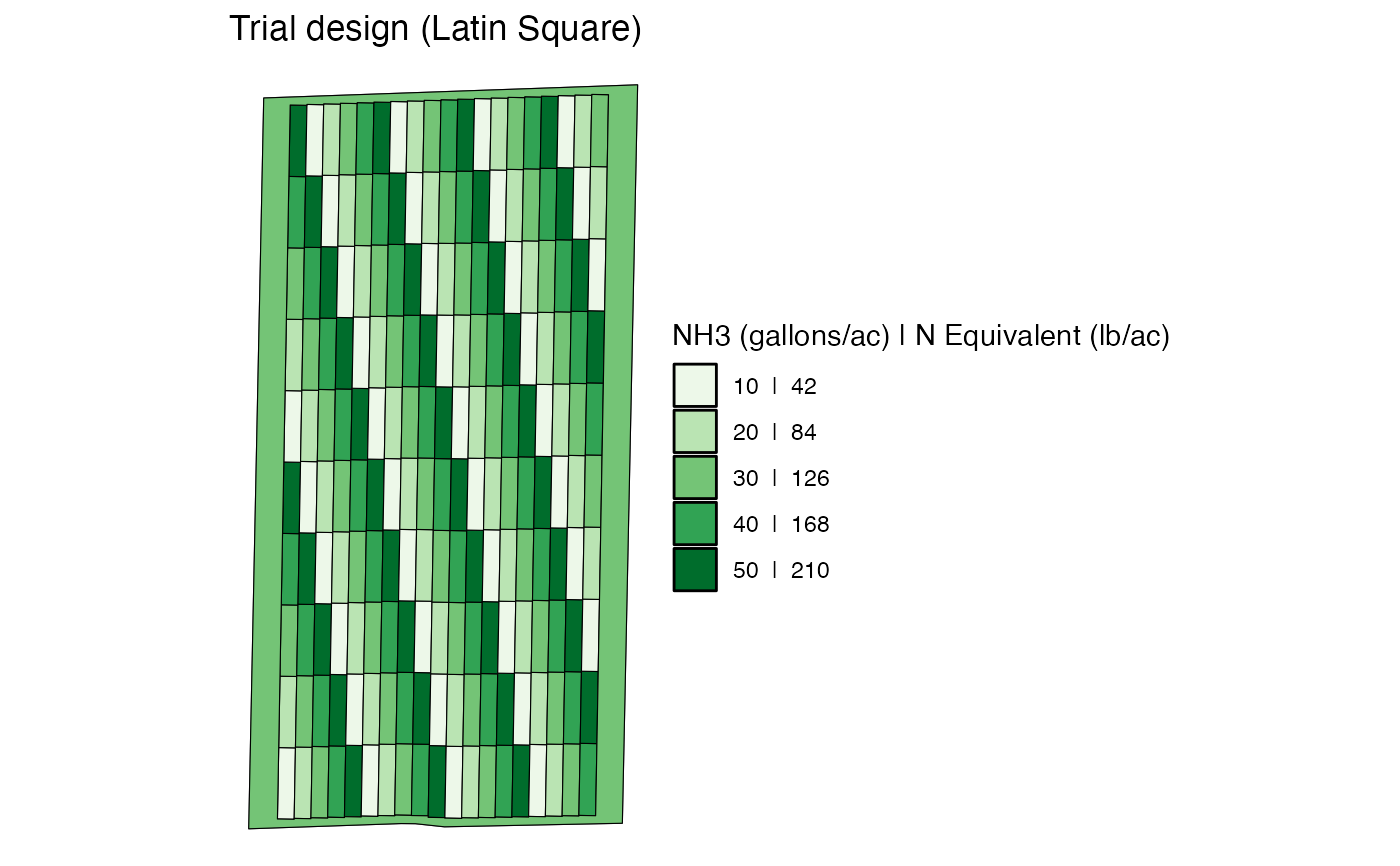
td <- assign_rates(exp_data, rate_info)
#--- visualization of the assigned rates ---#
viz(td)