Create plots of experiment rates, plot layout, plot_id, strip_id, and block_id, which can be specified by the `type` argument.
Usage
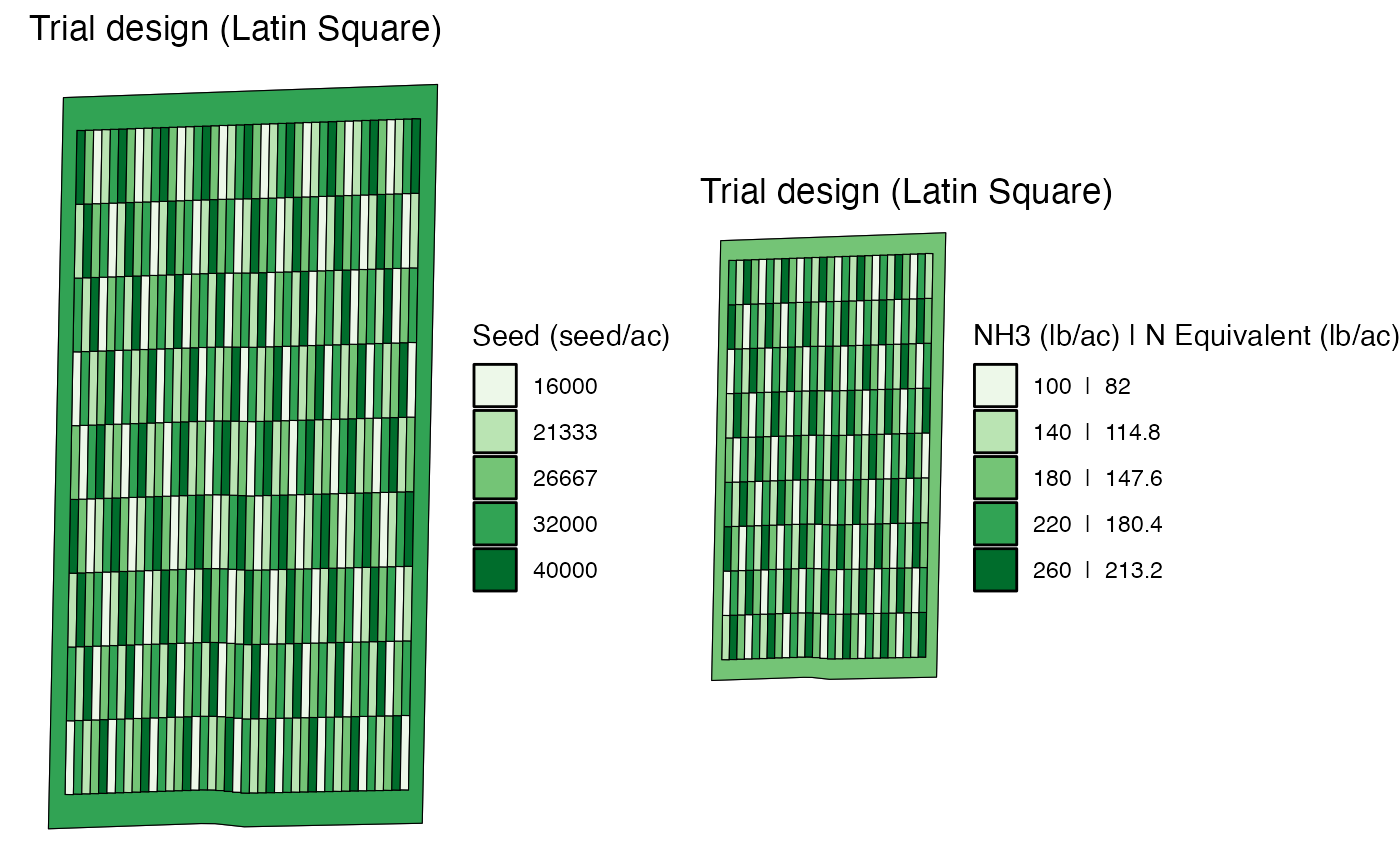
viz(
  td,
  type = "rates",
  input_index = c(1, 2),
  text_size = 3,
  abline = FALSE,
  leaflet = FALSE
)
Arguments
- td
(tibble) experiment plots made by make_exp_plots()
- type
(character) type of plots to create. Available options are "rates", "layout", "plot_id", "strip_id", "block_id", "ab_line"
- input_index
(numeric) a vector of length 1 or 2. 1 means the 1st input of the td, 2 means the second input of the td, and c(1, 2) means both of the inputs, which is the DEFAULT
- text_size
(numeric) the size of plot ID, strip ID, and block ID numbers printed in the plots
- abline
(logical) If TRUE, ab-lines are displayed as well. Default = FALSE. This applies only ton type = "rates" and type = "layout".
- leaflet
(logical) If TRUE, the plot will be superimposed on a satellite imagery of the field. Default is FALSE. This option is effective only for type = "rates".
Examples
#--- load trial design ---#
data(td_two_input)
viz(td_two_input)